GCSE
Physics
-
Introduction to GCSE Physics (AQA) Coming soon
-
1.1 Energy Stores, Transfers and Power
-
1.2 Conservation and Dissipation of Energy Coming soon
-
1.3 National and Global Energy Resources Coming soon
-
2.1 Current, Potential Difference and Resistance Coming soon
-
2.2 Series and Parallel Circuits Coming soon
-
2.3 Domestic Uses and Safety Coming soon
-
2.4 Energy Transfers Coming soon
-
2.5 Static Electricity Coming soon
-
3.1 Changes of State and the Particle Model Coming soon
-
3.2 Internal Energy and Energy Transfers Coming soon
-
3.3 Particle Model and Pressure Coming soon
-
4.1 Atoms and Isotopes Coming soon
-
4.2 Atoms and Nuclear Radiation Coming soon
-
4.3 Hazards and Uses of Radioactive Emissions and of Background Radiation Coming soon
-
4.4 Nuclear Fission and Fusion Coming soon
-
5.1 Forces and their Interactions Coming soon
-
5.2 Work Done and Energy Transfer Coming soon
-
5.3 Forces and Elasticity Coming soon
-
5.4 Moments, Levers and Gears Coming soon
-
5.5 Pressure and Pressure Differences in Fluids Coming soon
-
5.6 Forces and Motion Coming soon
-
5.6.1 Describing Motion Along a Line
-
5.6.2 Distance and Displacement
-
5.6.3 Speed
-
5.6.4 Velocity
-
5.6.5 The Distance–Time Relationship
-
5.6.6 Acceleration
-
5.6.7 Forces, Accelerations and Newton's Laws of Motion
-
5.6.8 Newton's First Law
-
5.6.9 Newton's Second Law
-
5.6.10 Newton's Third Law
-
5.6.11 Forces and Braking
-
5.6.12 Stopping Distance
-
5.6.13 Reaction Time
-
5.6.14 Factors Affecting Braking Distance
-
5.6.1 Describing Motion Along a Line
-
5.7 Momentum [HT] Coming soon
-
6.1 Waves in Air, Fluids and Solids Coming soon
-
6.2 Electromagnetic Waves Coming soon
-
6.3 Black Body Radiation Coming soon
-
7.1 Permanent and Induced Magnetism, Magnetic Forces and Fields Coming soon
-
7.2 The Motor Effect Coming soon
-
7.3 Induced Potential, Transformers and the National Grid [HT] Coming soon
-
8.1 Solar System; Stability of Orbital Motions; Satellites Coming soon
-
8.2 Red-Shift Coming soon
-
9.1 Required Practicals Coming soon
-
9.1.1 Required Practical Activity 1
-
9.1.2 Required Practical Activity 2
-
9.1.3 Required Practical Activity 3
-
9.1.4 Required Practical Activity 4
-
9.1.5 Required Practical Activity 5
-
9.1.6 Required Practical Activity 6
-
9.1.7 Required Practical Activity 7
-
9.1.8 Required Practical Activity 8
-
9.1.9 Required Practical Activity 9
-
9.1.10 Required Practical Activity 10
-
9.1.1 Required Practical Activity 1
1. Energy
Acceleration is a fundamental concept in the study of motion, representing how an object's velocity changes over time. It provides insights into the rate at which an object's speed or direction changes.
Average Acceleration
Average acceleration is the rate of change of velocity over a specific period. It is calculated by dividing the change in velocity by the time taken. The formula for average acceleration is:
a = ∆v / t
Variables:
- a = Acceleration in metres per second squared, m/s²
- ∆v = Change in velocity in metres per second, m/s
- t = Time in seconds, s
Positive and Negative Acceleration
- Positive Acceleration: When an object speeds up, its velocity and acceleration have the same direction. This is often referred to as "positive acceleration" or simply "acceleration."
- Negative Acceleration (Deceleration): When an object slows down, its velocity and acceleration have opposite directions. This is commonly known as "deceleration" or "negative acceleration."
Velocity-Time Graphs
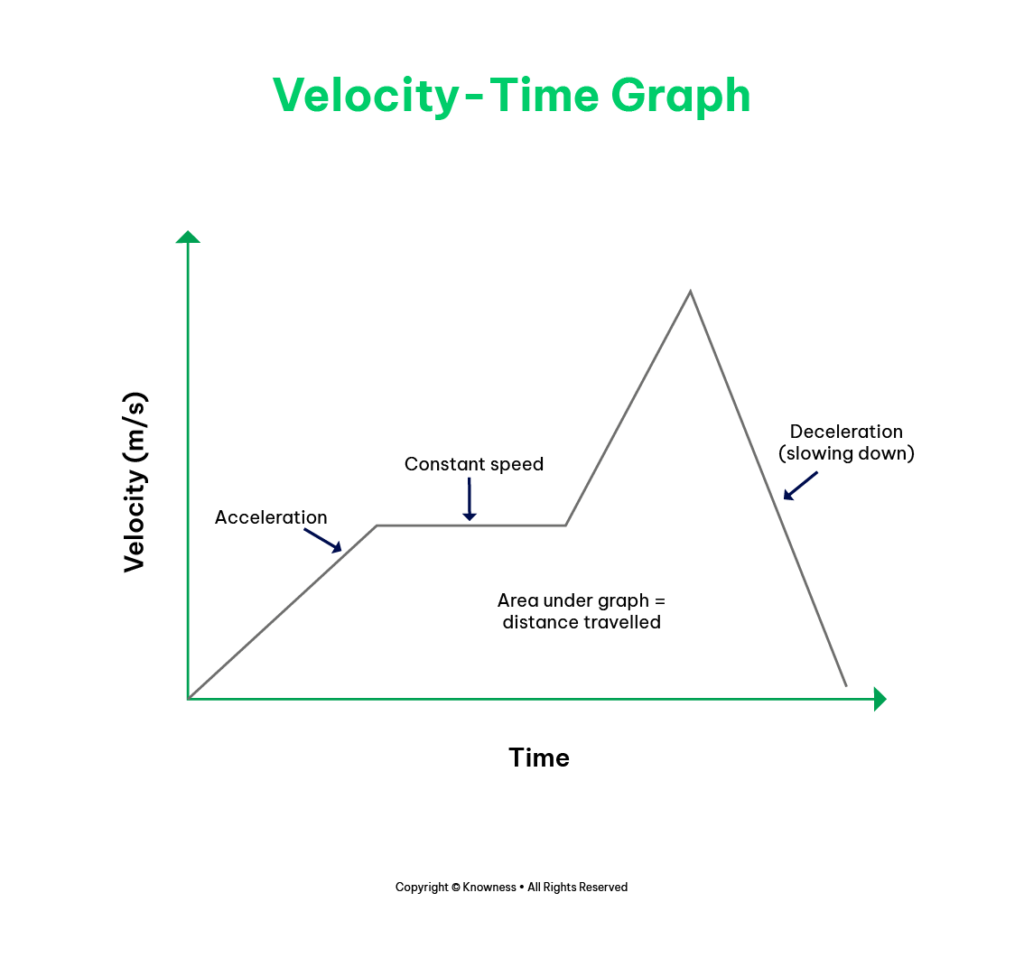
Acceleration from Velocity-Time Graphs:
- Gradient of Velocity-Time Graph: The gradient (slope) of a velocity-time graph represents the object's acceleration. It shows how the velocity is changing per unit of time. A steeper slope indicates a higher acceleration, while a gentler slope suggests a lower acceleration.
- Positive and Negative Acceleration: If the gradient of the velocity-time graph is positive, it indicates positive acceleration, meaning the object is speeding up. Conversely, a negative gradient indicates negative acceleration or deceleration, which means the object is slowing down.
- Flat Sections on the Graph: Flat sections on a velocity-time graph indicate zero acceleration. During these intervals, the object is moving at a constant velocity.
Distance/Displacement from Velocity-Time Graphs (HT only):
- Area under Velocity-Time Graph: The area under a velocity-time graph represents the distance travelled or the displacementThe forced removal of people from their land. of an object, depending on the specific scenario. It is important to distinguish between total distance and displacement.
- Interpreting Enclosed Areas: By calculating the area enclosed by the velocity-time graph, we can determine the distance travelled by an object. The area can be determined by dividing it into rectangles or triangles and summing their individual areas.
- Counting Squares: In some cases, students may need to measure the area under the velocity-time graph by counting the squares within the enclosed region.
Uniform Acceleration
For objects undergoing uniform acceleration, the equation below relates the final velocity (v), initial velocity (u), acceleration (a), and distance (s) travelled by the object:
v2 - u2 = 2as
Variables:
- v = Final velocity in metres per second, m/s
- u = Initial velocity in metres per second, m/s
- a = Acceleration in metres per second squared, m/s2
- s = Distance in metres, m
The equation shows that the change in velocity squared is directly proportional to the product of acceleration and the distance travelled. It allows us to calculate an unknown value (such as final velocity or distance) if we know the other variables.
Acceleration Due to Gravity
Objects falling freely under the influence of gravity experience an acceleration of approximately 9.8 m/s2 near the Earth's surface. This value is denoted as the acceleration due to gravity (g).
Terminal Velocity
When an object falls through a fluid (such as air or water), it initially accelerates due to the force of gravity. As the object gains speed, the resistance from the fluid (e.g., air resistance or drag) increases, opposing the downward motion.
Eventually, the fluid resistance force becomes equal in magnitude to the force of gravity. At this point, the resultant force on the object becomes zero, resulting in a constant velocity. This maximum velocity is known as the terminal velocity.
Velocity-Time Graphs for Objects with Terminal Velocity
- Drawing and Interpreting Velocity-Time Graphs: For objects that reach terminal velocity, the graph will show an initial period of acceleration followed by a constant velocity once the terminal velocity is reached.
- Analysing Motion: Initially, the object's velocity increases until the fluid resistance force matches the force of gravity, resulting in a constant velocity.
Conclusion
Understanding acceleration is crucial for quantifying and analysing changes in an object's velocity. By calculating average acceleration and considering its direction, we can determine how quickly an object's speed or direction is changing, distinguishing between positive acceleration (speeding up) and negative acceleration (slowing down) in various motion scenarios. Drawing and interpreting velocity-time graphs help us visualise an object's acceleration and gain insights into its changing velocity over time, thus deepening our understanding of the dynamics of objects in motion.
Continue the lesson
This section is available to learners with course access. Continue learning with Knowness to unlock the full explanation, examples, revision tools, and progress tracking.
The remaining lesson content includes further guided explanation, important learning points, and supporting interactive material designed to help you understand and revise this topic.
Unlock this topic to view the full activity, worked examples, common mistakes, and additional revision support.
More content available
Knowness lessons are structured to build understanding step by step. Create an account or upgrade your access to continue from this point.
This preview does not include the hidden lesson text, answers, explanations, or embedded interactions.
Continue learning with Knowness
Sign up to access the full lesson, predicted grades, revision tools, progress tracking, and more.
Create a free account