1.3.2 Business Revenues, Costs and Profits
In this lesson, we will delve into the crucial concepts of business revenues, costsThe sacrifices made when choosing a particular option, which may include money spent, time used, or resources consumed., and profits when putting a business idea into practice. We will explore the calculations and interpretations of revenue, fixed and variable costs, total costs, profitThe difference between the total revenue a business receives from sales and its total costs of production. and loss, interest, break-even level of output, and margin of safety.
Concept and Calculation of Key Financial Terms
To understand the financial health of a business, it is essential to grasp the following concepts and calculations.
- Revenue: Revenue refers to the total income generated by a business through its sales of products or servicesIntangible products that provide a skill, experience, or benefit rather than a physical item.. It is calculated by multiplying the quantity of goodsPhysical, tangible products that can be touched and stored. or services sold by their respective selling prices.
- Fixed Costs: Fixed costs are expenses that do not vary with the level of production or sales volume. Examples include rent, salaries, insurance, and utilities.
- Variable Costs: Variable costs are expenses that change proportionally with the level of production or sales. Examples include raw materials, direct labourThe human effort used in production, including both physical and mental work as well as workers’ skills and knowledge. costs, and sales commissions.
- Total Costs: Total costs represent the sum of fixed costs and variable costs incurred by a business in its operations.
- Profit and Loss: Profit is the positive financial gain a business realises when total revenue exceeds total costs. Loss, on the other hand, occurs when total costs exceed total revenue.
- Interest: Interest refers to the cost of borrowing money. It is typically calculated as a percentage of the borrowed amount.
Break-Even Analysis
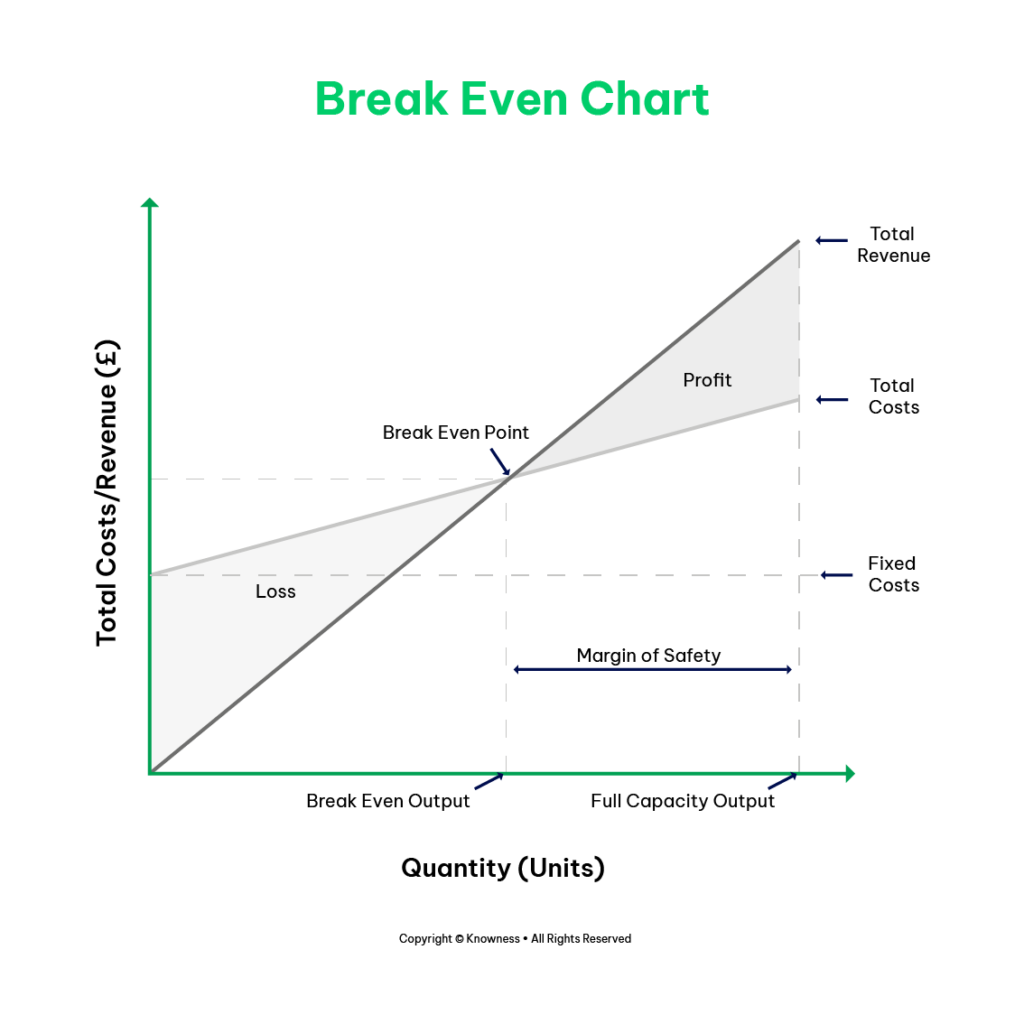
Break-even analysis helps entrepreneurs determine the level of output or sales needed to cover all costs and reach the break-even point. Understanding break-even diagrams involves the interpretation of several key elements:
- Break-Even Level of Output: The break-even level of output is the point at which total revenue equals total costs, resulting in neither profit nor loss. It indicates the minimum sales volume needed to cover all expenses.
- Margin of Safety: The margin of safety represents the difference between actual sales and the break-even level of output. It indicates how much sales can decline before the business starts incurring losses. A higher margin of safety provides a buffer against unforeseen changes in demand or costs.
- Impact of Changes in Revenue and Costs: Break-even diagrams help entrepreneurs visualise how changes in revenue or costs affect their profitability. By analysing these diagrams, entrepreneurs can assess the impact of price changes, cost reductions, or changes in production volume on their break-even point and overall financial performance.
- Profit and Loss: Break-even diagrams also depict the areas of profitability and loss. Entrepreneurs can analyse these diagrams to understand the level of output at which profits are achieved and the volume at which losses occur.
Conclusion
Understanding business revenues, costs, and profits is crucial when putting a business idea into practice. Calculating revenue, fixed and variable costs, and total costs allows entrepreneurs to assess their financial health. Break-even analysis helps entrepreneurs determine the level of output needed to reach the break-even point and assess the impact of changes in revenue and costs. Interpretation of break-even diagrams provides insights into the margin of safety, profit and loss thresholds, and the overall financial viability of the business.