1.2.3 Supply
In this lesson, we will explore the meaning of supply, how to draw and interpret a supply curve, analyse shifts and movements along the curve, discuss the causes and consequences for consumersIndividuals or households that buy and use goods and services to satisfy their needs and wants. and producersBusinesses or organisations that combine resources to produce goods and services for consumers., explain price elasticity of supply, draw supply curves of different elasticity, and evaluate the importance of price elasticity of supply for consumers and producers.
Supply
Supply refers to the quantity of a good or service that producers are willing and able to provide to the market at various price levels during a specific period. It represents the relationship between price and quantity supplied, assuming other factors remain constant.
Drawing and Interpreting a Supply Curve
A supply curve is a graphical representation that shows the relationship between the price of a product and the quantity supplied by producers. It slopes upward from left to right, indicating that as price increases, quantity supplied also increases, assuming other factors remain constant.
Individual supply represents the quantity of a product or service that an individual producer is willing and able to provide at various price levels. Market supply, on the other hand, is the total quantity supplied by all producers in the market at different prices.
Shifts of the Supply Curve
The supply curve can shift due to changes in factors other than price, known as determinants of supply. These determinants include production costsThe sacrifices made when choosing a particular option, which may include money spent, time used, or resources consumed., technology, resource availability, taxes and subsidies, governmentThe public authority that provides services, collects taxes, sets laws and regulations, and helps manage the economy. regulations, and more. A shift of the supply curve indicates a change in quantity supplied at all price levels.
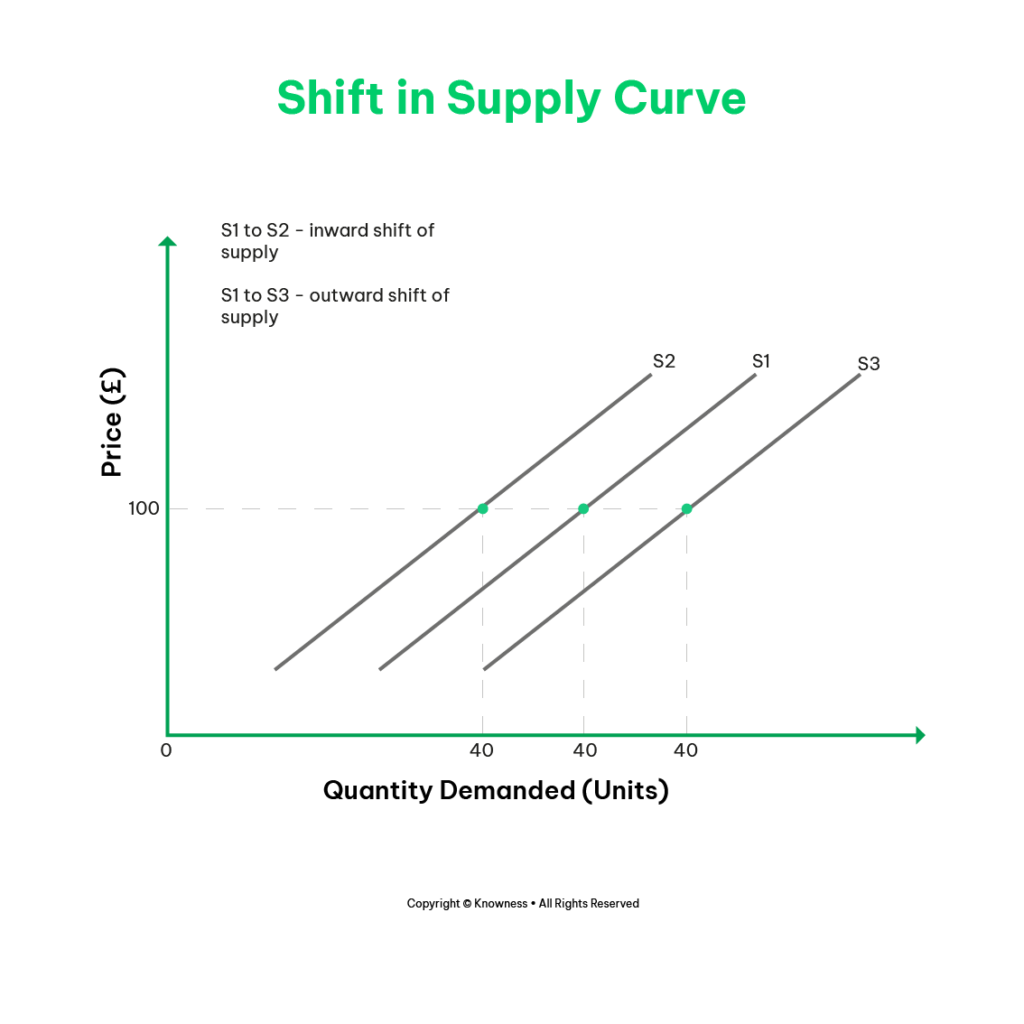
Changes in production costs, technological advancements, resource availability, changes in government policies, taxes and subsidies, and external factors such as natural disasters can cause shifts in the supply curve.
Shifts in the supply curve have implications for both consumers and producers. If supply increases, consumers may benefitThe gain or advantage received from making a particular economic decision. from lower prices and a greater availability of the product or service. Producers may experience increased sales and potential profits. Conversely, if supply decreases, consumers may face higher prices and potential product shortages. Producers may face decreased sales and potential losses.
Movements Along the Supply Curve
Movements along the supply curve occur in response to changes in the price of the product or service, assuming other factors remain constant. A change in price leads to a change in quantity supplied, resulting in a movement along the curve.
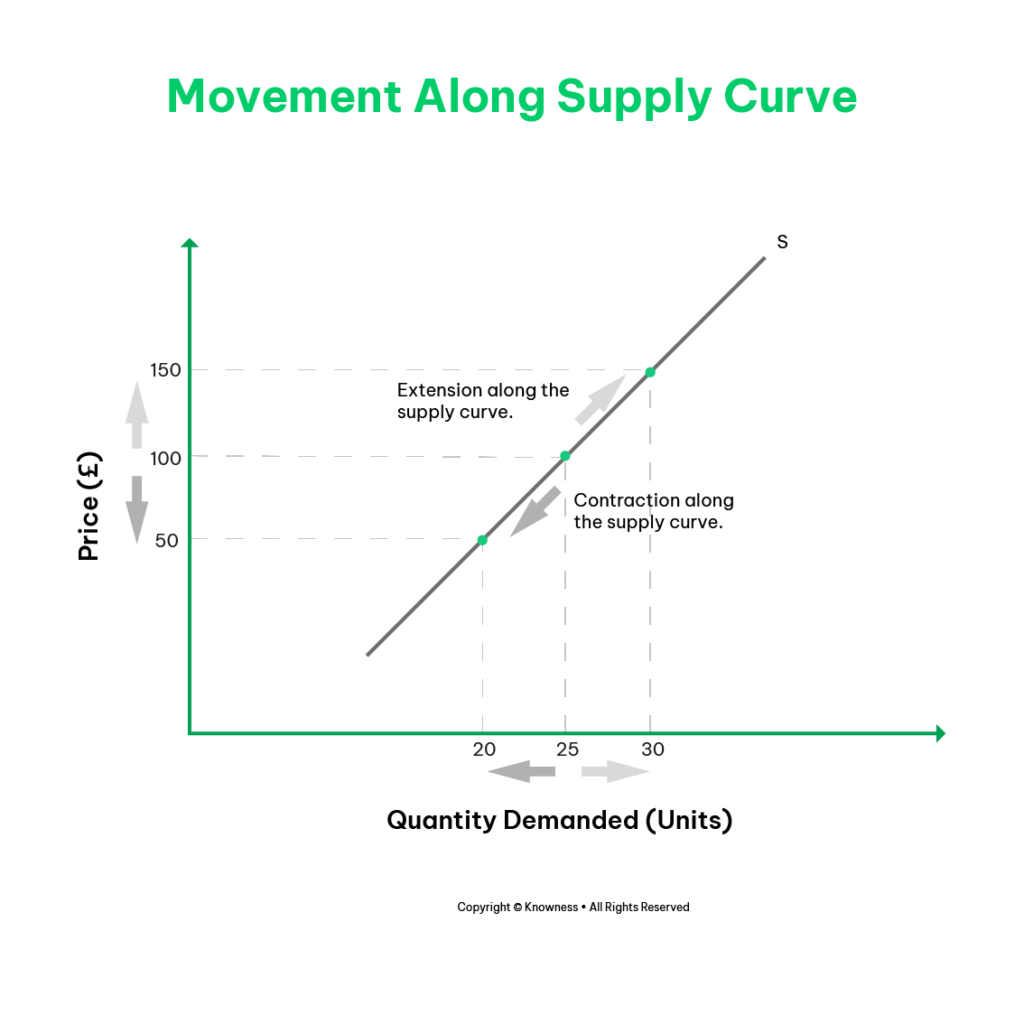
In contrast to shifts in the supply curve caused by external factors, movements along the supply curve result from changes in the price of the product itself. When the price of a good or service changes, producers respond by adjusting the quantity supplied, leading to a movement along the supply curve.
When the price of a product or service increases, producers are encouraged to supply more, benefiting consumers with a greater availability of the product. Conversely, if the price decreases, producers may reduce supply to avoid losses, potentially leading to reduced availability for consumers. A decrease in price leads to an increase in consumer surplus, enabling greater satisfaction, while an increase in price raises producer surplus, allowing potential investment in production expansion. Movements along the supply curve ultimately result in a new market equilibrium, where the quantity supplied equals the quantity demanded, determining the prevailing market price and quantity.
Price Elasticity of Supply
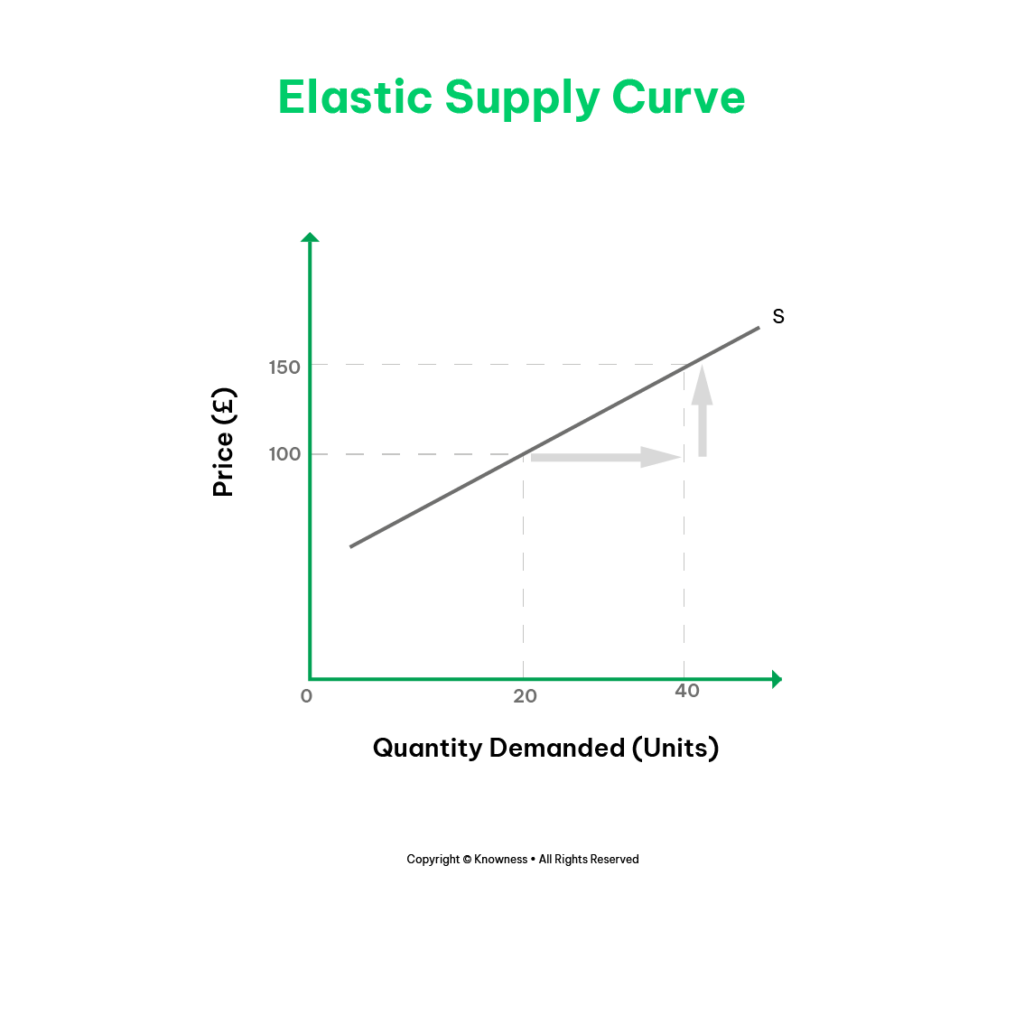
Price elasticity of supply measures the responsiveness of quantity supplied to changes in price. It determines how sensitive producers are to price fluctuations.
Elastic Supply: If a small change in price leads to a significant change in quantity supplied, supply is considered elastic. The supply curve for elastic goodsPhysical, tangible products that can be touched and stored. or servicesIntangible products that provide a skill, experience, or benefit rather than a physical item. is relatively flat.
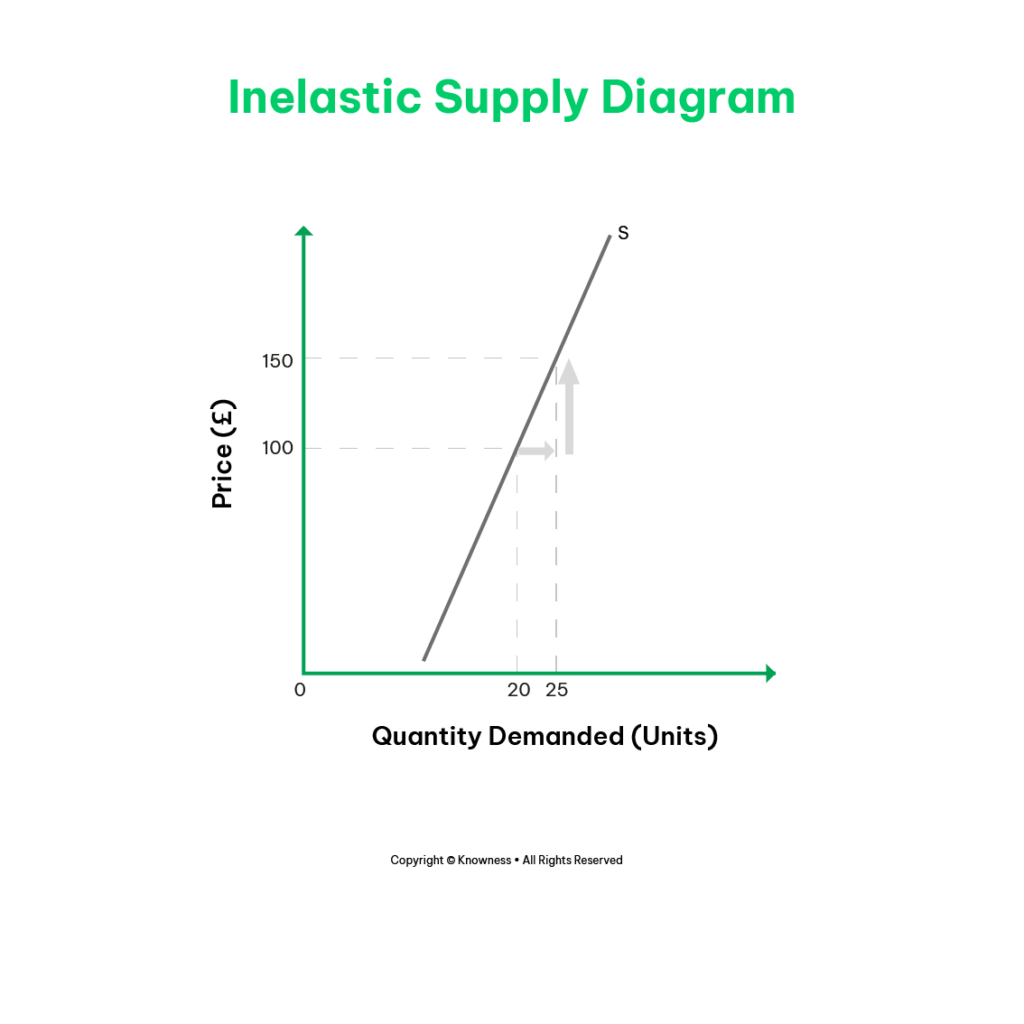
Inelastic Supply: If a change in price has little impact on quantity supplied, supply is considered inelastic. The supply curve for inelastic goods or services is relatively steep.
Importance of Price Elasticity of Supply for Consumers and Producers
Consumers: Price elasticity of supply is important for consumers as it helps predict how prices will respond to changes in supply. If supply is elastic, consumers can expect price adjustments to be relatively small, allowing for greater affordability. In contrast, inelastic supply may result in more significant price fluctuations, impacting consumer purchasing power.
Producers: Price elasticity of supply is essential for producers to understand how changes in price affect their production decisions. If supply is elastic, producers can respond to price changes by adjusting their production levels to maximise profits. Inelastic supply may limit producers' ability to increase output, potentially resulting in higher prices and increased profitability.
Conclusion
The supply curve represents the relationship between price and quantity supplied, while shifts and movements along the curve are influenced by various factors. Price elasticity of supply determines the sensitivity of producers to price changes and plays a significant role in their production decisions and profitability.