1.1.5 Global Atmospheric Circulation
In this lesson, we will explore what determines weather and climate patterns through the general atmospheric circulation model, including pressure belts and surface winds. We will also see how this can be used to explain tropical storm formation and location.
The Challenge of Weather Hazards
Weather hazards are extreme weather events that threaten people, property, and the environment. These include tropical storms such as hurricanes and cyclones, as well as more frequent and intense events like heat waves, heavy rainfall, snowstorms, and droughts. As global temperatures rise due to climate change, weather hazards are becoming more unpredictable and more severe in many parts of the world.
General Atmospheric Circulation Model
Earth is surrounded by a thin layer of air called the atmosphere. The general atmospheric circulation model describes the global patterns of air movement and pressure systems.
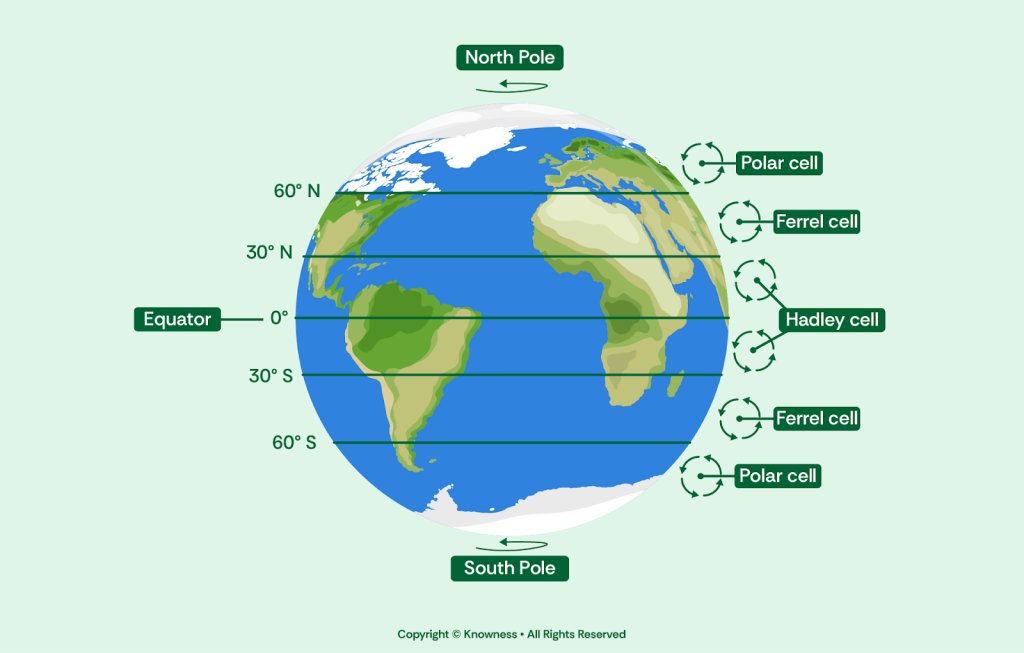
Hadley Cell
This circulation is driven by the difference in solar heating between the temperature at the equator and the poles. Because of earth’s curvature, the sun’s solar heating does not heat Earth’s surface evenly. This is why the equator experiences higher temperatures than the poles.
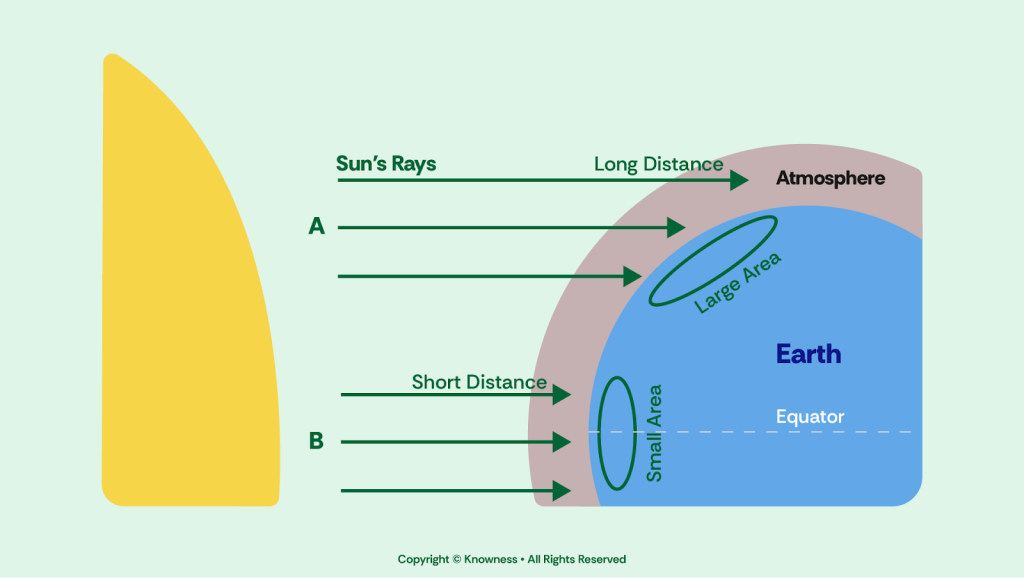
Higher surface temperature warms the air. When air is warmed the molecules spread apart, causing the air mass to become less dense. Therefore, the warm air mass rises and the area becomes low pressure.
The rising air takes evaporated water vapour from the oceans. As the air rises, it begins to cool because it is no longer receiving as much heat from Earth’s surface, as it cools the water vapour condenses and forms large clouds, ultimately resulting in high volumes of rainfall.
As air rises even more, at the upper atmosphere, air is forced either North or South of the equator. At around 30 degrees North and South, the air begins to sink and cooling makes the air mass more dense. This creates a high pressure system.
Trade winds carry the sinking air back towards the equator, completing the atmospheric circulation of the Hadley Cell.
Ferrel Cell
At 30 degrees, warm air is pulled either North (N) or South (S) either from the westerlies to 60 degrees N/S of the equator. At this point, the warm air meets the cold polar air that has been moved by the polar easterlies. At this point of interaction, there is a mix, forcing the warm air to rise (as it is less dense). This creates a low pressure area known as the subpolar low.
Polar Cell
The rising warm air at 60 degrees N/S and moves towards the poles. Air immediately sinks over the poles. While it is not warm, it is extremely dry, and can result in a few centimeters of snow a year.
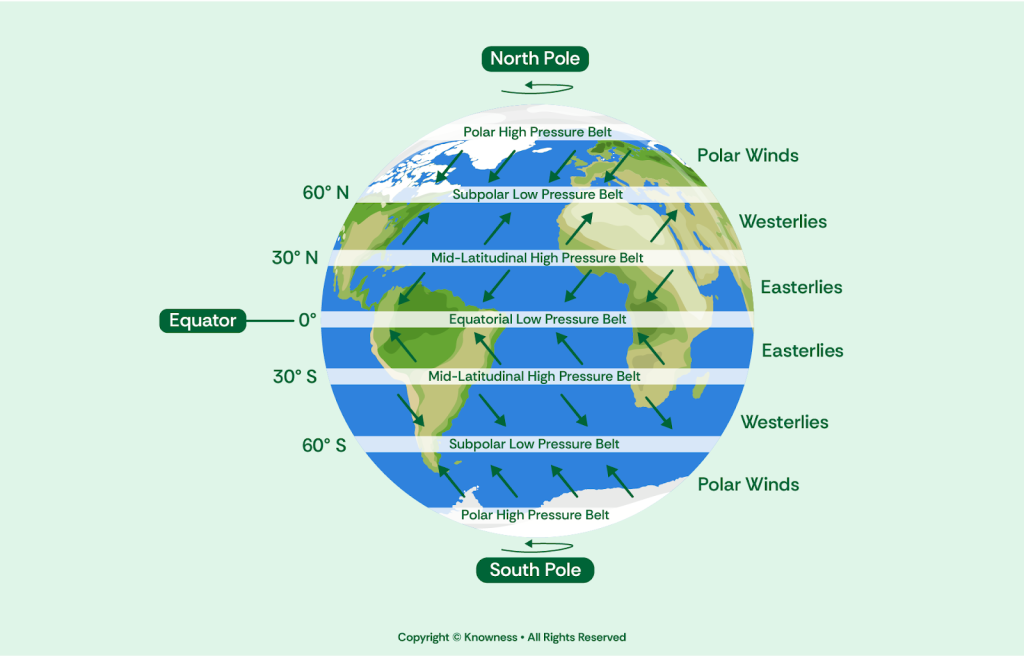
Pressure Belts
Atmospheric pressure belts are large, regular patterns of high and low pressure that form around the Earth. They are created by the way the Sun heats the Earth unevenly, with the equator receiving more heat than the poles. Warm air rises at the equator, creating a low-pressure belt (the equatorial low), while cooler air sinks at about 30° north and south, forming high-pressure belts (the subtropical highs).
These belts explain why some parts of the world are very wet (like the equator with lots of rain) while others are very dry (like deserts around 30° north and south).
Equatorial Low Pressure Belt (Intertropical Convergence Zone – ITCZ)
Located near the equator. At this point, the trade winds from the northern and southern- hadley cells meet. Because of the rising warm air, low pressure, and meeting of the trade winds, this region experiences heavy rainfall, and frequent thunderstorms.
Subtropical High Pressure Belts
Found around 30 degrees north and south of the equator, these belts experience descending air, and therefore a high pressure weather system. This equates to calm winds, very little precipitation, and therefore desert-like conditions.
Subpolar Low Pressure Belts
Located around 60 degrees north and south of the equator, these belts experience ascending air, and therefore a low pressure weather system. This means the climate experiences storms, unstable weather patterns and leads to environments similar to that of the UK.
Polar High Pressure Belts
Situated near the poles, these belts have cold, descending air masses, resulting in cold and dry conditions.
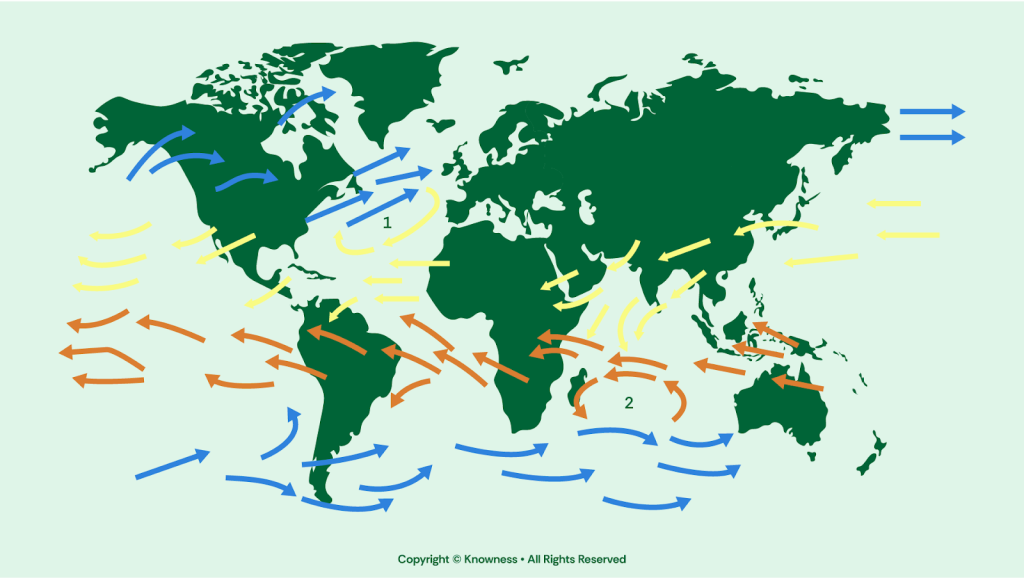
Surface Winds
Surface winds are the winds that blow close to Earth’s surface, typically measured at 10 meters above surface level (to minimise the influence of local obstructions like buildings or trees). There are different types of surface winds:
- Trade Winds: These winds blow from the subtropical high-pressure belts toward the equatorial low-pressure belt in both hemispheres. They are known as the northeast trades in the Northern Hemisphere and the southeast trades in the Southern Hemisphere.
- Prevailing Westerlies: These winds blow from the subtropical high-pressure belts toward the subpolar low-pressure belts in both hemispheres. They are responsible for weather patterns in mid-latitudes.
- Polar Easterlies: These winds blow from the polar high-pressure belts toward the subpolar low-pressure belts in both hemispheres.